Multiple Choice
Figure 9-22
The following diagram shows the domestic demand and domestic supply in a market.In addition,assume that the world price in this market is $40 per unit. 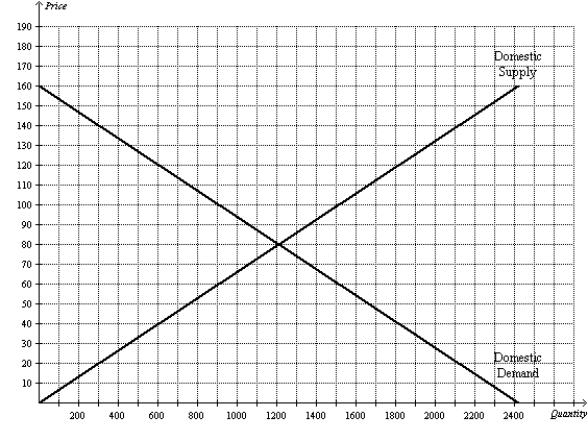
-Refer to Figure 9-22.With free trade,total surplus is
A) $30,000.
B) $66,000.
C) $96,000.
D) $120,000.
Correct Answer:

Verified
Correct Answer:
Verified
Q5: When a country allows trade and becomes
Q19: Figure 9-5<br>The figure illustrates the market for
Q20: Figure 9-6<br>The figure illustrates the market for
Q21: Denmark is an importer of computer chips
Q22: Figure 9-1<br>The figure illustrates the market for
Q23: Scenario 9-2<br>• For a small country called
Q26: Mexico has imposed a tariff on the
Q27: Figure 9-1<br>The figure illustrates the market for
Q28: If the United States imports televisions and
Q110: The world price of a pound of