Multiple Choice
Figure 9-22
The following diagram shows the domestic demand and domestic supply in a market.In addition,assume that the world price in this market is $40 per unit. 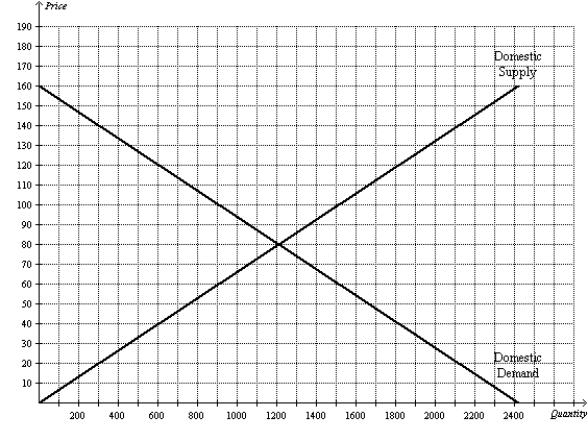
-Refer to Figure 9-22.Suppose the government imposes a tariff of $20 per unit.With trade and a tariff,total surplus is
A) $96,000.
B) $114,000.
C) $120,000.
D) $126,000.
Correct Answer:

Verified
Correct Answer:
Verified
Q45: Figure 9-3.The domestic country is China. <img
Q46: Figure 9-11 <img src="https://d2lvgg3v3hfg70.cloudfront.net/TB2297/.jpg" alt="Figure 9-11
Q47: Figure 9-20<br>The figure illustrates the market for
Q48: When a country that imports a particular
Q49: When a country allows trade and becomes
Q51: Figure 9-16.The figure below illustrates a tariff.On
Q52: Figure 9-17 <img src="https://d2lvgg3v3hfg70.cloudfront.net/TB2297/.jpg" alt="Figure 9-17
Q53: Suppose Iceland goes from being an isolated
Q54: Suppose Iceland goes from being an isolated
Q55: If Freedonia changes its laws to allow