Multiple Choice
Figure 9-22
The following diagram shows the domestic demand and domestic supply in a market.In addition,assume that the world price in this market is $40 per unit. 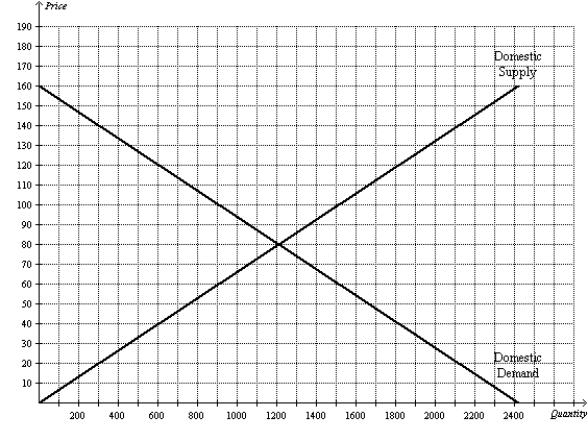
-Refer to Figure 9-22.Suppose the government imposes a tariff of $20 per unit.Relative to the free-trade outcome,the imposition of the tariff
A) decreases imports of the good by 300 units and increases domestic production of the good by 300 units.
B) decreases imports of the good by 300 units and increases domestic production of the good by 600 units.
C) decreases imports of the good by 600 units and increases domestic production of the good by 300 units.
D) decreases imports of the good by 600 units and increases domestic production of the good by 600 units.
Correct Answer:

Verified
Correct Answer:
Verified
Q268: Figure 9-4.The domestic country is Nicaragua. <img
Q269: Figure 9-6<br>The figure illustrates the market for
Q270: Figure 9-15 <img src="https://d2lvgg3v3hfg70.cloudfront.net/TB2297/.jpg" alt="Figure 9-15
Q271: When a nation first begins to trade
Q272: Suppose a country abandons a no-trade policy
Q274: For any country that allows free trade,<br>A)domestic
Q275: Figure 9-20<br>The figure illustrates the market for
Q276: Figure 9-26<br>The diagram below illustrates the market
Q277: Scenario 9-2<br>• For a small country called
Q278: Figure 9-13 <img src="https://d2lvgg3v3hfg70.cloudfront.net/TB2297/.jpg" alt="Figure 9-13