Multiple Choice
Figure 9-23
The following diagram shows the domestic demand and domestic supply for a market.Assume that the world price in this market is $120 per unit. 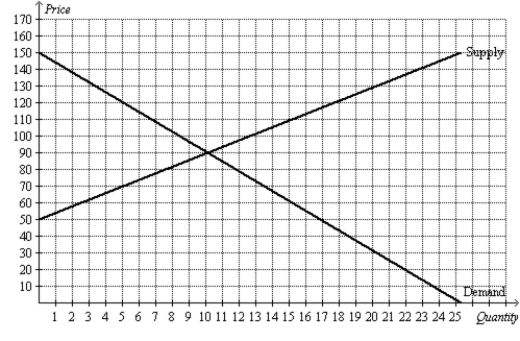
-Refer to Figure 9-23.With free trade,the domestic price and domestic quantity demanded are
A) $90 and 5.
B) $90 and 10.
C) $120 and 5.
D) $120 and 18.
Correct Answer:

Verified
Correct Answer:
Verified
Q37: When a country abandons a no-trade policy,adopts
Q38: Figure 9-1<br>The figure illustrates the market for
Q39: Figure 9-13 <img src="https://d2lvgg3v3hfg70.cloudfront.net/TB2297/.jpg" alt="Figure 9-13
Q40: Figure 9-5<br>The figure illustrates the market for
Q41: Figure 9-24<br>The following diagram shows the domestic
Q43: Figure 9-13 <img src="https://d2lvgg3v3hfg70.cloudfront.net/TB2297/.jpg" alt="Figure 9-13
Q44: Figure 9-10.The figure applies to Mexico and
Q45: Figure 9-3.The domestic country is China. <img
Q46: Figure 9-11 <img src="https://d2lvgg3v3hfg70.cloudfront.net/TB2297/.jpg" alt="Figure 9-11
Q47: Figure 9-20<br>The figure illustrates the market for