Multiple Choice
Figure 9-23
The following diagram shows the domestic demand and domestic supply for a market.Assume that the world price in this market is $120 per unit. 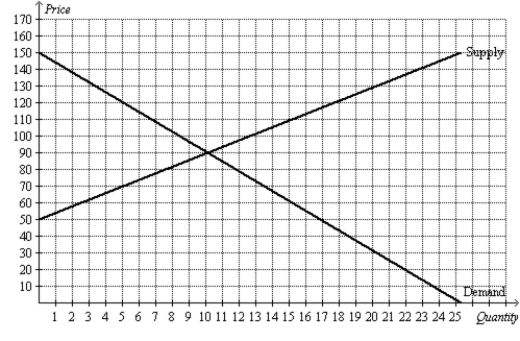
-Refer to Figure 9-23.With free trade allowed,this country
A) exports 5 units of the good.
B) imports 5 units of the good.
C) exports 13 units of the good.
D) imports 13 units of the good.
Correct Answer:

Verified
Correct Answer:
Verified
Q86: Figure 9-6<br>The figure illustrates the market for
Q87: Figure 9-1<br>The figure illustrates the market for
Q88: An import quota<br>A)is preferable to a tariff
Q89: Figure 9-10.The figure applies to Mexico and
Q90: Figure 9-3.The domestic country is China. <img
Q92: Figure 9-12 <img src="https://d2lvgg3v3hfg70.cloudfront.net/TB2297/.jpg" alt="Figure 9-12
Q93: Figure 9-5<br>The figure illustrates the market for
Q94: When a country moves away from a
Q95: Figure 9-11 <img src="https://d2lvgg3v3hfg70.cloudfront.net/TB2297/.jpg" alt="Figure 9-11
Q96: Figure 9-1<br>The figure illustrates the market for