Multiple Choice
Figure 9-23
The following diagram shows the domestic demand and domestic supply for a market. Assume that the world price in this market is $120 per unit. 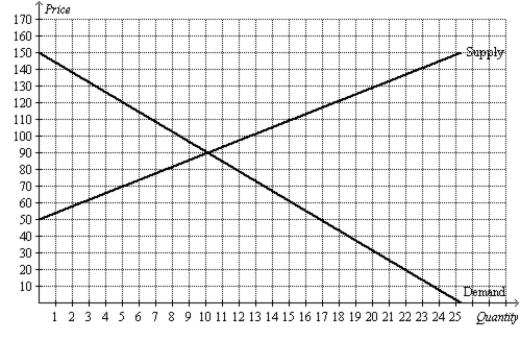
-Refer to Figure 9-23. Producer surplus with free trade is
A) $200.
B) $450.
C) $630.
D) $1,080
Correct Answer:

Answered by ExamLex AI
Correct Answer:
Answered by ExamLex AI
Q11: Figure 9-29<br>The following diagram shows the domestic
Q40: Which of the following is the most
Q84: When a nation first begins to trade
Q86: Figure 9-6<br>The figure illustrates the market for
Q105: If the United Kingdom imports tea cups
Q114: Figure 9-24<br>The following diagram shows the domestic
Q201: Figure 9-21<br>The following diagram shows the domestic
Q259: Domestic producers of a good become better
Q261: Figure 9-12 <img src="https://d2lvgg3v3hfg70.cloudfront.net/TB2297/.jpg" alt="Figure 9-12
Q501: With which of the Ten Principles of