Multiple Choice
Figure 9-24
The following diagram shows the domestic demand and supply in a market.Assume that the world price in this market is $20 per unit. 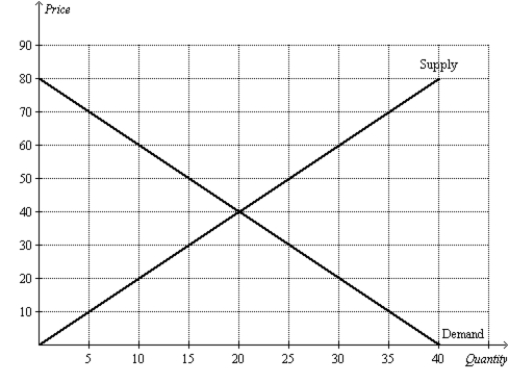
-Refer to Figure 9-24.With free trade,consumer surplus is
A) $400 and producer surplus is $100.
B) $400 and producer surplus is $400.
C) $900 and producer surplus is $100.
D) $900 and producer surplus is $400.
Correct Answer:

Verified
Correct Answer:
Verified
Q99: Figure 9-6 <img src="https://d2lvgg3v3hfg70.cloudfront.net/TB7555/.jpg" alt="Figure 9-6
Q110: Within a country,the domestic price of a
Q111: Figure 9-1<br>The figure illustrates the market for
Q112: Figure 9-11 <img src="https://d2lvgg3v3hfg70.cloudfront.net/TB2297/.jpg" alt="Figure 9-11
Q113: Suppose that the U.S.has a comparative advantage
Q115: Figure 9-15 <img src="https://d2lvgg3v3hfg70.cloudfront.net/TB2297/.jpg" alt="Figure 9-15
Q116: Figure 9-2<br>The figure illustrates the market for
Q117: Figure 9-7.The figure applies to the nation
Q118: After a country goes from disallowing trade
Q119: When a country allows trade and becomes