Multiple Choice
Figure 9-24
The following diagram shows the domestic demand and supply in a market.Assume that the world price in this market is $20 per unit. 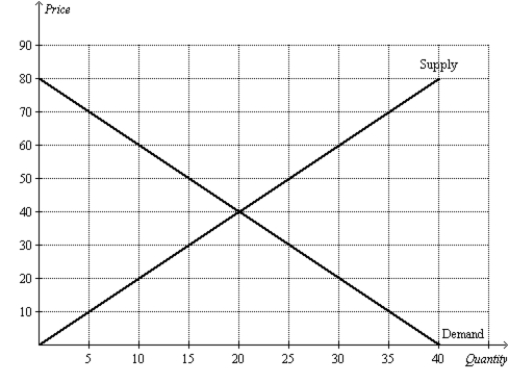
-Refer to Figure 9-24.With free trade,total surplus is
A) $500.
B) $800.
C) $1,000.
D) $1,300.
Correct Answer:

Verified
Correct Answer:
Verified
Q96: Figure 9-1<br>The figure illustrates the market for
Q97: Figure 9-6<br>The figure illustrates the market for
Q98: Figure 9-5<br>The figure illustrates the market for
Q100: A tariff is a tax placed on<br>A)an
Q102: Some time ago,the nation of Republica opened
Q103: When a country allows trade and becomes
Q104: Scenario 9-1<br>The before-trade domestic price of peaches
Q105: Figure 9-17 <img src="https://d2lvgg3v3hfg70.cloudfront.net/TB2297/.jpg" alt="Figure 9-17
Q106: Figure 9-3.The domestic country is China. <img
Q107: Suppose the world price of a television