Multiple Choice
Figure 9-25
The following diagram shows the domestic demand and supply in a market.Assume that the world price in this market is $10 per unit. 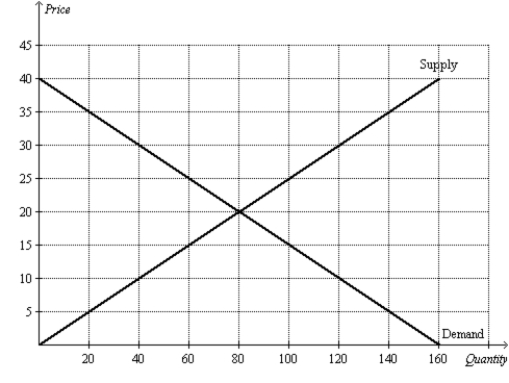
-Refer to Figure 9-25.Suppose the government imposes a tariff of $5 per unit.With trade and a tariff,total surplus is
A) $1,700.
B) $1,800.
C) $1,900.
D) $2,000.
Correct Answer:

Verified
Correct Answer:
Verified
Q117: Figure 9-6 <img src="https://d2lvgg3v3hfg70.cloudfront.net/TB7555/.jpg" alt="Figure 9-6
Q172: Scenario 9-1<br>The before-trade domestic price of peaches
Q173: Figure 9-4.The domestic country is Nicaragua. <img
Q174: Figure 9-1<br>The figure illustrates the market for
Q175: Figure 9-9 <img src="https://d2lvgg3v3hfg70.cloudfront.net/TB2297/.jpg" alt="Figure 9-9
Q176: Figure 9-2<br>The figure illustrates the market for
Q178: Figure 9-17 <img src="https://d2lvgg3v3hfg70.cloudfront.net/TB2297/.jpg" alt="Figure 9-17
Q179: A quota is<br>A)a tax placed on imports.<br>B)a
Q181: When a country that imports a particular
Q182: Figure 9-12 <img src="https://d2lvgg3v3hfg70.cloudfront.net/TB2297/.jpg" alt="Figure 9-12