Multiple Choice
Figure 9-25
The following diagram shows the domestic demand and supply in a market.Assume that the world price in this market is $10 per unit. 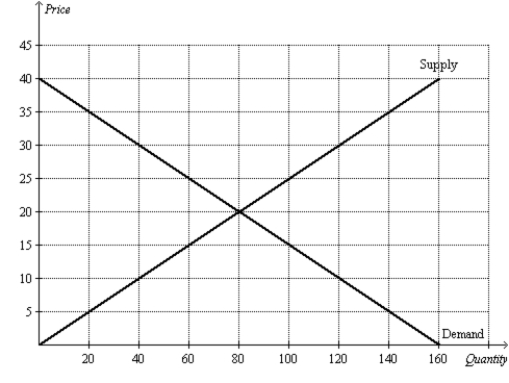
-Refer to Figure 9-25.Suppose the government imposes a tariff of $5 per unit.The amount of revenue collected by the government from the tariff is
A) $50.
B) $100.
C) $150.
D) $200.
Correct Answer:

Verified
Correct Answer:
Verified
Q233: Figure 9-24<br>The following diagram shows the domestic
Q234: When a certain nation abandoned a policy
Q235: Scenario 9-1<br>The before-trade domestic price of peaches
Q236: Figure 9-6<br>The figure illustrates the market for
Q237: Scenario 9-2<br>• For a small country called
Q239: When a country allows trade and becomes
Q240: A tariff<br>A)lowers the domestic price of the
Q241: Figure 9-2<br>The figure illustrates the market for
Q242: Figure 9-17 <img src="https://d2lvgg3v3hfg70.cloudfront.net/TB2297/.jpg" alt="Figure 9-17
Q243: Figure 9-18.On the diagram below,Q represents the