Multiple Choice
Figure 9-25
The following diagram shows the domestic demand and supply in a market.Assume that the world price in this market is $10 per unit. 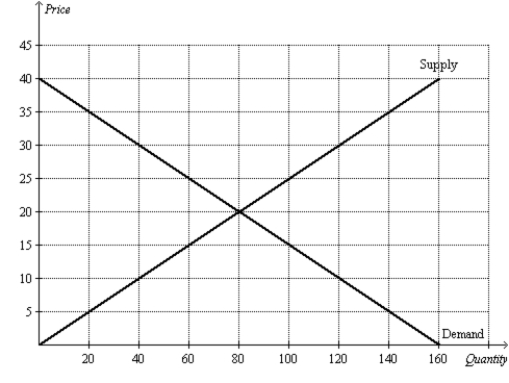
-Refer to Figure 9-25.With free trade and a $5 per unit tariff,the country
A) exports 20 units of the good.
B) imports 20 units of the good.
C) exports 40 units of the good.
D) imports 40 units of the good.
Correct Answer:

Verified
Correct Answer:
Verified
Q12: When a country allows trade and becomes
Q13: Figure 9-12 <img src="https://d2lvgg3v3hfg70.cloudfront.net/TB2297/.jpg" alt="Figure 9-12
Q14: Figure 9-15 <img src="https://d2lvgg3v3hfg70.cloudfront.net/TB2297/.jpg" alt="Figure 9-15
Q15: Figure 9-12 <img src="https://d2lvgg3v3hfg70.cloudfront.net/TB2297/.jpg" alt="Figure 9-12
Q16: When a country that imported a particular
Q18: When a country allows trade and becomes
Q19: Figure 9-5<br>The figure illustrates the market for
Q20: Figure 9-6<br>The figure illustrates the market for
Q21: Denmark is an importer of computer chips
Q22: Figure 9-1<br>The figure illustrates the market for