Short Answer
Figure 9-26
The following diagram shows the domestic demand and domestic supply curves in a market. 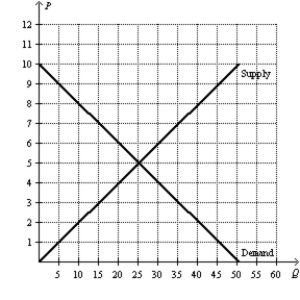
-Refer to Figure 9-26.Suppose the world price in this market is $7.If the country allows free trade,by how much do consumer surplus,producer surplus,and total surplus change with trade?
Correct Answer:

Verified
With trade,consumer surplus fa...View Answer
Unlock this answer now
Get Access to more Verified Answers free of charge
Correct Answer:
Verified
View Answer
Unlock this answer now
Get Access to more Verified Answers free of charge
Q10: Scenario 9-3<br>Suppose domestic demand and domestic supply
Q11: Figure 9-29<br>The following diagram shows the domestic
Q12: Scenario 9-3<br>Suppose domestic demand and domestic supply
Q14: Figure 9-29<br>The following diagram shows the domestic
Q18: Scenario 9-3<br>Suppose domestic demand and domestic supply
Q19: Figure 9-27<br>The following diagram shows the domestic
Q20: Figure 9-26<br>The following diagram shows the domestic
Q41: Suppose in the country of Jumanji that
Q182: Suppose the world price of coffee is
Q190: List five arguments given to support trade