Short Answer
Figure 9-27
The following diagram shows the domestic demand and supply curves in a market.Assume that the world price in this market is $20 per unit. 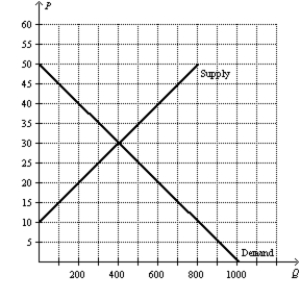
-Refer to Figure 9-27.With no trade allowed,how much are consumer surplus,producer surplus,and total surplus?
Correct Answer:

Verified
Without trade,consum...View Answer
Unlock this answer now
Get Access to more Verified Answers free of charge
Correct Answer:
Verified
View Answer
Unlock this answer now
Get Access to more Verified Answers free of charge
Q3: Figure 9-29<br>The following diagram shows the domestic
Q4: Figure 9-29<br>The following diagram shows the domestic
Q5: Figure 9-26<br>The following diagram shows the domestic
Q9: Figure 9-27<br>The following diagram shows the domestic
Q10: Scenario 9-3<br>Suppose domestic demand and domestic supply
Q11: Figure 9-29<br>The following diagram shows the domestic
Q12: Scenario 9-3<br>Suppose domestic demand and domestic supply
Q147: Suppose in the country of Nash that
Q159: List four benefits of international trade.
Q190: List five arguments given to support trade