Short Answer
Figure 9-28
The following diagram shows the domestic demand and domestic supply curves in a market. 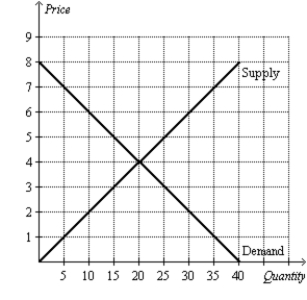
-Refer to Figure 9-28.Suppose the world price in this market is $6.If the country allows free trade,how much is consumer surplus?
Correct Answer:

Verified
With trade...View Answer
Unlock this answer now
Get Access to more Verified Answers free of charge
Correct Answer:
Verified
View Answer
Unlock this answer now
Get Access to more Verified Answers free of charge
Q20: Figure 9-26<br>The following diagram shows the domestic
Q21: Scenario 9-3<br>Suppose domestic demand and domestic supply
Q22: Figure 9-27<br>The following diagram shows the domestic
Q26: Figure 9-28<br>The following diagram shows the domestic
Q27: Figure 9-29<br>The following diagram shows the domestic
Q28: Figure 9-27<br>The following diagram shows the domestic
Q29: Figure 9-27<br>The following diagram shows the domestic
Q30: Figure 9-28<br>The following diagram shows the domestic
Q66: What are the arguments in favor of
Q128: A tax on an imported good is