Short Answer
Figure 9-29
The following diagram shows the domestic demand and domestic supply curves in a market.Assume that the world price in this market is $1 per unit. 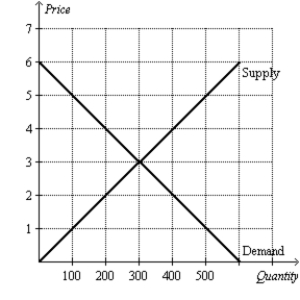
-Refer to Figure 9-29.If the country allows free trade,how much are consumer surplus,producer surplus,and total surplus with trade?
Correct Answer:

Verified
With trade,consumer ...View Answer
Unlock this answer now
Get Access to more Verified Answers free of charge
Correct Answer:
Verified
View Answer
Unlock this answer now
Get Access to more Verified Answers free of charge
Q43: Figure 9-26<br>The following diagram shows the domestic
Q44: Figure 9-26<br>The following diagram shows the domestic
Q45: Figure 9-28<br>The following diagram shows the domestic
Q46: Figure 9-28<br>The following diagram shows the domestic
Q47: Figure 9-27<br>The following diagram shows the domestic
Q48: Scenario 9-3<br>Suppose domestic demand and domestic supply
Q50: Figure 9-28<br>The following diagram shows the domestic
Q51: Figure 9-29<br>The following diagram shows the domestic
Q53: Scenario 9-3<br>Suppose domestic demand and domestic supply
Q193: Characterize the two different approaches a nation