Short Answer
Figure 9-29
The following diagram shows the domestic demand and domestic supply curves in a market.Assume that the world price in this market is $1 per unit. 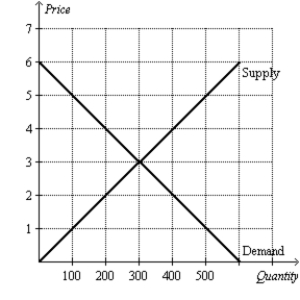
-Refer to Figure 9-29.Suppose the country imposes a $1 per unit tariff.If the country allows trade with a tariff,how much are consumer surplus and producer surplus?
Correct Answer:

Verified
With trade and a tar...View Answer
Unlock this answer now
Get Access to more Verified Answers free of charge
Correct Answer:
Verified
View Answer
Unlock this answer now
Get Access to more Verified Answers free of charge
Q6: How does an import quota differ from
Q29: Figure 9-27<br>The following diagram shows the domestic
Q30: Figure 9-28<br>The following diagram shows the domestic
Q31: Figure 9-26<br>The following diagram shows the domestic
Q36: Figure 9-29<br>The following diagram shows the domestic
Q37: Figure 9-29<br>The following diagram shows the domestic
Q38: Figure 9-29<br>The following diagram shows the domestic
Q39: Figure 9-29<br>The following diagram shows the domestic
Q164: A country has a comparative advantage in
Q179: Suppose in the country of Nash that