Multiple Choice
Figure 27-11 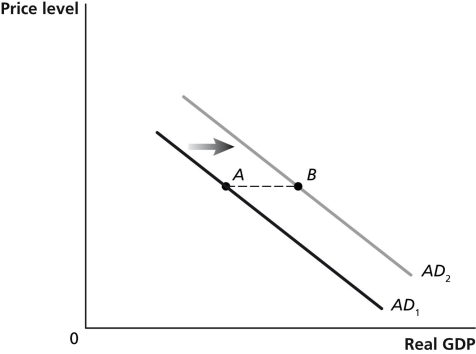
-Refer to Figure 27-11.In the graph above,the shift from AD1 to AD2 represents the total change in aggregate demand.If government purchases increased by $50 billion,then the distance from point A to point B ________ $50 billion.
A) would be equal to
B) would be greater than
C) would be less than
D) may be greater than or less than
Correct Answer:

Verified
Correct Answer:
Verified
Q76: The nation of Hyperbole is in a
Q115: Which of the following provides health-care coverage
Q245: Government deficits tend to increase during<br>A)recessions and
Q269: Which of the following statements about the
Q270: Part of the spending on the Doyle
Q272: The largest source of federal government revenue
Q274: Forecasts by the Congressional Budget Office show
Q276: If tax reduction and simplification are effective,then<br>A)real
Q277: Table 27-2<br> <span class="ql-formula" data-value="\begin{array}
Q301: The double taxation problem occurs because households