Multiple Choice
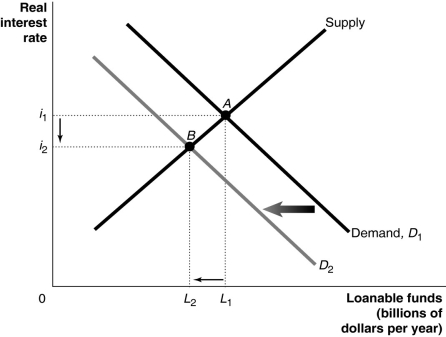
Figure 21-2 
-Refer to Figure 21-2.Which of the following is consistent with the graph depicted above?
A) An expected expansion increases the profitability of new investment.
B) The government runs a budget surplus.
C) There is a shift from an income tax to a consumption tax.
D) New government regulations decrease the profitability of new investment.
Correct Answer:

Verified
Correct Answer:
Verified
Q11: Potential GDP is estimated to grow at
Q13: Because Corning produces durable goods,the demand for
Q15: Give three reasons why the U.S.economy is
Q24: When the government runs a budget deficit,we
Q63: Which of the following is most liquid?<br>A)a
Q72: Figure 21-6 <img src="https://d2lvgg3v3hfg70.cloudfront.net/TB7397/.jpg" alt="Figure 21-6
Q152: In a closed economy,public saving plus private
Q186: Explain and show graphically how an increase
Q226: _ is the ease with which a
Q247: If GDP grows at a rate of