Multiple Choice
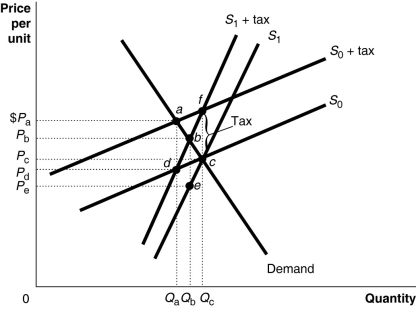 Figure 18-2 shows a demand curve and two sets of supply curves,one set more elastic than the other.
-Refer to Figure 18-2.If the government imposes an excise tax of $1.00 on every unit sold,the consumer's burden of the tax
A) is Pa - Pc under either supply curve.
B) is Pb - Pc under either supply curve.
C) is Pa - Pc if the supply curve is S0 and Pb - Pc if the supply curve is S1.
D) is Pa - Pd if the supply curve is S0 and Pb - Pe if the supply curve is S1.
Correct Answer:

Verified
Correct Answer:
Verified
Q2: Figure 18-6<br> <img src="https://d2lvgg3v3hfg70.cloudfront.net/TB4193/.jpg" alt="Figure 18-6
Q20: The poverty rate is defined as the
Q73: The actual division of the burden of
Q120: The government of Silverado raises revenue to
Q140: Horizontal equity is achieved when taxes are
Q141: As a group, people with high incomes
Q149: When the demand for a product is
Q150: Consider the following methods of taxing a
Q201: Between 1970 and 2010, the poverty rate
Q253: A tax is efficient if<br>A)individuals with the