Multiple Choice
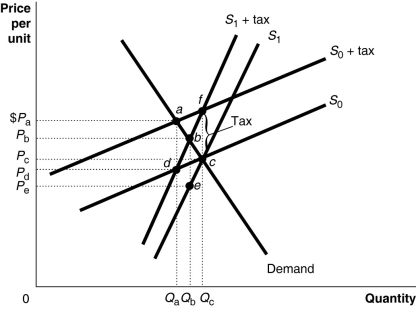 Figure 18-2 shows a demand curve and two sets of supply curves,one set more elastic than the other.
-Refer to Figure 18-2.If the government imposes an excise tax of $1.00 on every unit sold,the consumer's burden of the tax
A) is greater under the more elastic supply curve S0.
B) is greater under the less elastic supply curve S0.
C) is greater under the less elastic supply curve S1.
D) is the same under either supply curve because there is a single demand curve that captures buyers' market behavior.
Correct Answer:

Verified
Correct Answer:
Verified
Q63: The sales tax<br>A)is consistent with the benefits-received
Q165: Describe each of the principles governments consider
Q179: A personal exemption refers to<br>A)the tax rate
Q186: The median voter theorem states that the
Q198: The median voter model implies that<br>A)many people
Q200: Measures of poverty (for example, the poverty
Q228: Last year,Anthony Millanti earned exactly $30,000
Q233: Why is a typical person likely to
Q234: According to the ability-to-pay principle of taxation<br>A)individuals
Q248: Many state governments use lotteries to raise