Multiple Choice
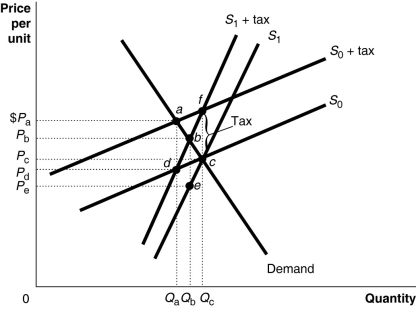 Figure 18-2 shows a demand curve and two sets of supply curves,one set more elastic than the other.
-Refer to Figure 18-2.If the government imposes an excise tax of $1.00 on every unit sold,the government's revenue from the tax is represented by the area
A) (PaPc × Qa) if the supply curve is S0 and (PbPc × Qb) if the supply curve is S1.
B) (PaPd × Qa) if the supply curve is S0 and (PbPe × Qb) if the supply curve is S1.
C) (PaPe × Qa) under either supply curve.
D) (PbPe × Qb) under either supply curve.
Correct Answer:

Verified
Correct Answer:
Verified
Q130: Of the following sources of tax revenue
Q168: For a given supply curve, how does
Q179: A personal exemption refers to<br>A)the tax rate
Q185: The Gini coefficient is measured by<br>A)summing up
Q186: The median voter theorem states that the
Q198: The median voter model implies that<br>A)many people
Q200: Measures of poverty (for example, the poverty
Q219: Figure 18-1<br> <img src="https://d2lvgg3v3hfg70.cloudfront.net/TB4193/.jpg" alt="Figure 18-1
Q223: Figure 18-4<br> <img src="https://d2lvgg3v3hfg70.cloudfront.net/TB4193/.jpg" alt="Figure 18-4
Q236: In the United States, the federal income