Essay
Figure 18-3 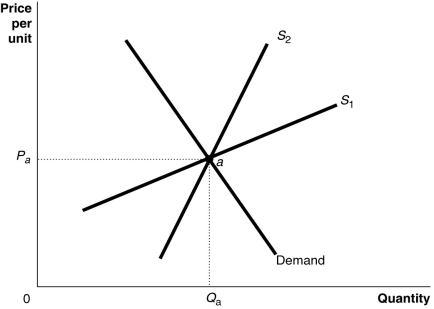
-Refer to Figure 18-3.The figure above shows a demand curve and two supply curves,one more elastic than the other.Use Figure 18-3 to answer the following questions.
a.Suppose the government imposes an excise tax of $1.00 on every unit sold.Use the graph to illustrate the impact of this tax.
b.If the government imposes an excise tax of $1.00 on every unit sold,will the consumer pay more of the tax if the supply curve is S1 or S2? Refer to the graphs in your answer.
c.If an excise tax of $1.00 on every unit sold is imposed,will the revenue collected by the government be greater if the supply curve is S1 or S2?
d.If the government imposes an excise tax of $1.00 on every unit sold,will the deadweight loss be greater if the supply curve is S1 or S2?
Correct Answer:

Verified
a.The supply curve shifts up by the full...View Answer
Unlock this answer now
Get Access to more Verified Answers free of charge
Correct Answer:
Verified
View Answer
Unlock this answer now
Get Access to more Verified Answers free of charge
Q19: Figure 18-1<br> <img src="https://d2lvgg3v3hfg70.cloudfront.net/TB4193/.jpg" alt="Figure 18-1
Q30: Rapid economic growth tends to increase the
Q60: If the marginal tax rate is equal
Q75: Table 18-9<br> <img src="https://d2lvgg3v3hfg70.cloudfront.net/TB4193/.jpg" alt="Table 18-9
Q90: Which of the following statements about rent
Q138: If the government wants to minimize the
Q144: What is logrolling?<br>A)a situation where a policymaker
Q181: Article Summary<br>Monthly marijuana sales in Colorado topped
Q220: What are the two types of taxes
Q230: A marginal tax rate is<br>A)the fraction of