Multiple Choice
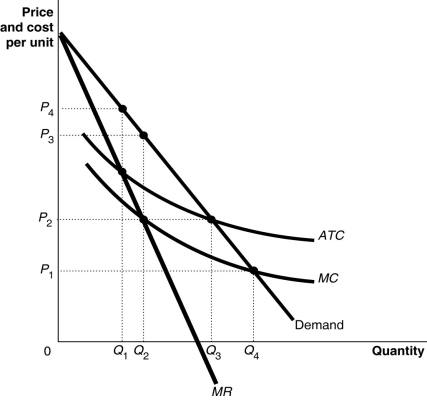 Figure 15-15 shows the cost and demand curves for the Erickson Power Company.
-Refer to Figure 15-15.The profit-maximizing price is
A) P1.
B) P2.
C) P3.
D) P4.
Correct Answer:

Verified
Correct Answer:
Verified
Q8: If you own the only bookstore in
Q57: Figure 15-15<br> <img src="https://d2lvgg3v3hfg70.cloudfront.net/TB4193/.jpg" alt="Figure 15-15
Q63: The De Beers Company, one of the
Q87: In Walnut Creek, California, there are three
Q113: The International Nickel Company of Canada is
Q152: Figure 15-4<br> <img src="https://d2lvgg3v3hfg70.cloudfront.net/TB4192/.jpg" alt="Figure 15-4
Q184: <img src="https://d2lvgg3v3hfg70.cloudfront.net/TB3018/.jpg" alt=" Figure 15-2 above
Q187: Figure 15-10 <img src="https://d2lvgg3v3hfg70.cloudfront.net/TB3018/.jpg" alt="Figure 15-10
Q202: Consider an industry that is made up
Q204: A United States government patent lasts<br>A)forever.<br>B)50 years.<br>C)20