Multiple Choice
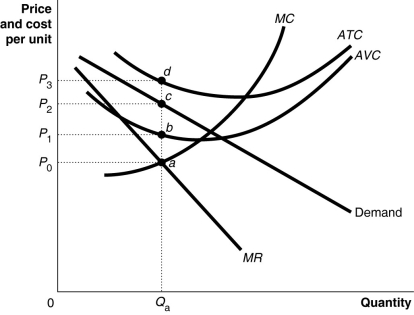 Figure 13-4 shows short-run cost and demand curves for a monopolistically competitive firm in the market for designer watches.
-Refer to Figure 13-4.What is the area that represents the total fixed cost of production?
A) 0P1aQa
B) P0adP3
C) P1bdP3
D) That information cannot be determined from the graph.
Correct Answer:

Verified
Correct Answer:
Verified
Q16: A monopolistically competitive market is described as
Q35: When new firms are encouraged to enter
Q55: Most economists believe that consumers would be
Q71: Which of the following can a firm
Q137: A monopolistically competitive firm is producing an
Q174: Explain the significance of brand management to
Q188: Table 13-1<br> <img src="https://d2lvgg3v3hfg70.cloudfront.net/TB4193/.jpg" alt="Table 13-1
Q211: In the short run, a profit-maximizing firm's
Q212: Long-run equilibrium in a monopolistically competitive market
Q245: If a monopolistically competitive firm breaks even,