Multiple Choice
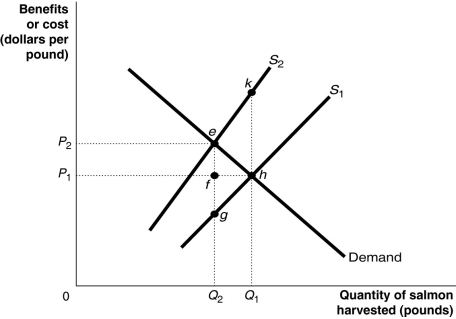 Figure 5-15 shows the market for Atlantic salmon,a common resource.The current market equilibrium output of Q1 is not the economically efficient output.The economically efficient output is Q2.
-Refer to Figure 5-15.The current market equilibrium output is partly the result of overfishing.In that case,what does S1 represent?
A) the private marginal benefit of harvesting salmon
B) the social marginal benefit of harvesting salmon
C) the private marginal cost of harvesting salmon
D) the social marginal cost of harvesting salmon
Correct Answer:

Verified
Correct Answer:
Verified
Q48: Figure 5-16<br> <img src="https://d2lvgg3v3hfg70.cloudfront.net/TB4193/.jpg" alt="Figure 5-16
Q86: For certain public projects such as building
Q91: How does a public good differ from
Q93: A market supply curve reflects the<br>A)external costs
Q103: The marginal social cost of a good
Q119: <img src="https://d2lvgg3v3hfg70.cloudfront.net/TB3018/.jpg" alt=" Figure 5-2 shows
Q120: Private solutions to the problem of externalities
Q142: When negative externalities exist, the competitive market
Q242: Anyone can purchase sulfur dioxide emission allowances
Q257: When there is a positive externality in