Multiple Choice
Figure 3-1 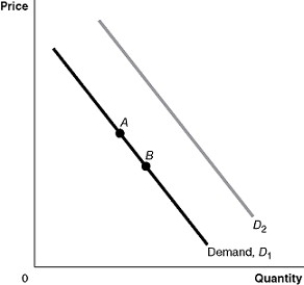
-Refer to Figure 3-1.An increase in population would be represented by a movement from
A) A to B.
B) B to A.
C) D1 to D2.
D) D2 to D1.
Correct Answer:

Verified
Correct Answer:
Verified
Related Questions
Q26: What would happen in the market for
Q49: Even when the demand for one good
Q62: A change in quantity supplied is represented
Q63: Figure 3-5 <img src="https://d2lvgg3v3hfg70.cloudfront.net/TB1236/.jpg" alt="Figure 3-5
Q69: Suppose that when the price of hamburgers
Q109: Draw a demand curve and label it
Q116: Figure 3-1 <img src="https://d2lvgg3v3hfg70.cloudfront.net/TB3018/.jpg" alt="Figure 3-1
Q180: Assume that the price for swimming pool
Q204: What is the difference between a market
Q430: An decrease in quantity supplied is represented