Multiple Choice
Figure 3-1 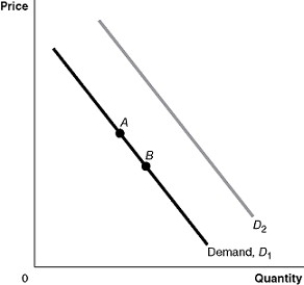
-Refer to Figure 3-1.A decrease in taste or preference would be represented by a movement from
A) A to B.
B) B to A.
C) D1 to D2.
D) D2 to D1.
Correct Answer:

Verified
Correct Answer:
Verified
Related Questions
Q31: A decrease in input costs in the
Q32: A surplus is defined as the situation
Q57: Prices of microbrewery beer (assume that this
Q76: What would happen in the market for
Q95: George Gnat subscribes to a monthly pest
Q100: Technological advances have resulted in lower prices
Q142: In 1984, the National Minimum Drinking Age
Q156: Table 3-3<br> <img src="https://d2lvgg3v3hfg70.cloudfront.net/TB7397/.jpg" alt="Table 3-3
Q215: Prices of smartphones (assume that this is
Q223: Figure 3-8 <img src="https://d2lvgg3v3hfg70.cloudfront.net/TB3018/.jpg" alt="Figure 3-8