Multiple Choice
Figure 3-1 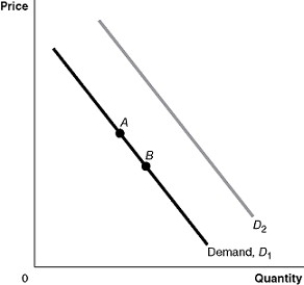
-Refer to Figure 3-1.A decrease population would be represented by a movement from
A) A to B.
B) B to A.
C) D1 to D2.
D) D2 to D1.
Correct Answer:

Verified
Correct Answer:
Verified
Related Questions
Q14: An increase in the equilibrium quantity of
Q53: Figure 3-7 <img src="https://d2lvgg3v3hfg70.cloudfront.net/TB1236/.jpg" alt="Figure 3-7
Q101: Which of the following would cause an
Q109: Which of the following would cause an
Q126: If an increase in income leads to
Q143: If the demand curve for a product
Q158: In July,market analysts predict that the price
Q211: A growing number of cigar manufacturers in
Q317: Draw a demand curve and label it
Q320: Explain the Law of Demand.