Multiple Choice
Figure 3-2 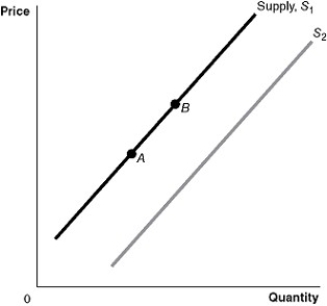
-Refer to Figure 3-2.A decrease in the number of firms in the market would be represented by a movement from
A) A to B.
B) B to A.
C) S1 to S2.
D) S2 to S1.
Correct Answer:

Verified
Correct Answer:
Verified
Related Questions
Q33: Several studies have shown promising links between
Q49: How does the increasing use of MP3
Q51: What is the difference between an "increase
Q71: Assume that the hourly price for the
Q134: The Internet has created a new category
Q146: The popularity of digital cameras has enticed
Q146: Which of the following would cause both
Q174: Explain how it would be possible for
Q465: Figure 3-2 <img src="https://d2lvgg3v3hfg70.cloudfront.net/TB3018/.jpg" alt="Figure 3-2
Q466: Use the following supply schedule for