Multiple Choice
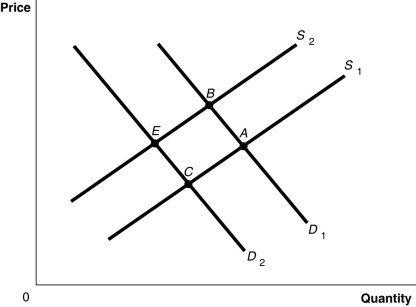
Figure 3-8 
-Refer to Figure 3-8.The graph in this figure illustrates an initial competitive equilibrium in the market for apples at the intersection of D1 and S2 (point B) .Which of the following changes would cause the equilibrium to change to point C?
A) a positive change in the technology used to produce apples and decrease in the price of oranges,a substitute for apples
B) an increase in the wages of apple workers and an increase in the price of oranges,a substitute for apples
C) an increase in the number of apple producers and a decrease in the number of apple trees as a result of disease
D) a decrease in the wages of apple workers and an increase in the price of oranges,a substitute for apples
Correct Answer:

Verified
Correct Answer:
Verified
Q5: How has the growing popularity of factory
Q35: The law of demand implies, holding everything
Q45: Figure 3-4 <img src="https://d2lvgg3v3hfg70.cloudfront.net/TB1236/.jpg" alt="Figure 3-4
Q71: Vineyards can grow either red wine grapes
Q73: If the demand for a product increases
Q113: Technological advancements have led to lower prices
Q159: The substitution effect explains why there is
Q166: Figure 3-5<br> <img src="https://d2lvgg3v3hfg70.cloudfront.net/TB4193/.jpg" alt="Figure 3-5
Q178: Which of the following statements is true?<br>A)An
Q203: Figure 3-4 <img src="https://d2lvgg3v3hfg70.cloudfront.net/TB1236/.jpg" alt="Figure 3-4