Multiple Choice
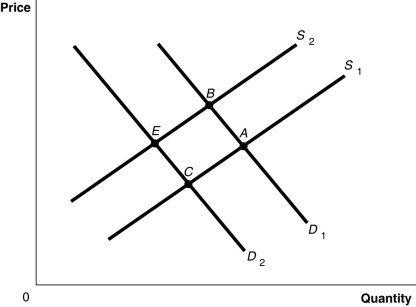
Figure 3-8 
-Refer to Figure 3-8.The graph in this figure illustrates an initial competitive equilibrium in the market for motorcycles at the intersection of D1 and S2 (point B) .If there is an increase in number of companies producing motorcycles and a decrease in income (assume motorcycles are a normal good) ,the equilibrium could move to which point?
A) A
B) B
C) C
D) E
Correct Answer:

Verified
Correct Answer:
Verified
Q9: According to a recent study,"Stricter college alcohol
Q23: If the price of peaches,a substitute for
Q55: Which of the following statements is true?<br>A)An
Q82: What is the difference between an "increase
Q110: Figure 3-7 <img src="https://d2lvgg3v3hfg70.cloudfront.net/TB1236/.jpg" alt="Figure 3-7
Q146: What is the ceteris paribus condition?
Q174: Figure 3-5 <img src="https://d2lvgg3v3hfg70.cloudfront.net/TB1236/.jpg" alt="Figure 3-5
Q198: A decrease in the price of GPS
Q207: The income effect explains why there is
Q224: What is a surplus? What is a