Multiple Choice
Figure 1-1
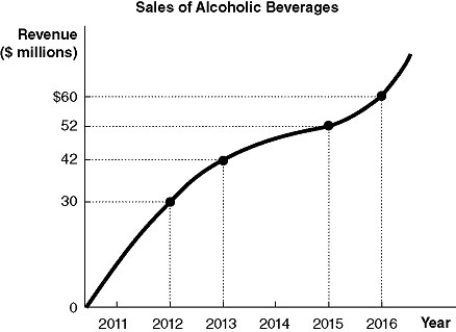
-Refer to Figure 1-1.Using the information in the figure above, calculate the percentage change in sales of alcoholic beverages between 2012 and 2016.
A) 30%
B) 50%
C) 66.7%
D) 100%
Correct Answer:

Verified
Correct Answer:
Verified
Q40: _ have a horizontal and a vertical
Q60: Figure 1-2<br> <img src="https://d2lvgg3v3hfg70.cloudfront.net/TB4193/.jpg" alt="Figure 1-2
Q73: Allison's Auto Art is a company that
Q122: By definition, economics is the study of<br>A)how
Q148: When Mr.Peabody decides on the companies to
Q213: Explain the difference between a firm's revenue
Q219: When every good or service is produced
Q220: Suppose the U.S.government encouraged consumers to trade
Q224: Mr.Peabody chooses to invest in companies that
Q229: Which of the following statements about the