Multiple Choice
Figure 1.1 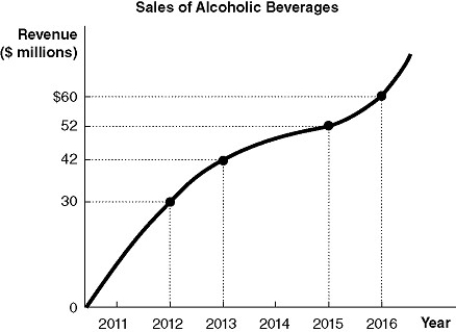
-Refer to Figure 1-1.Using the information in the figure above,calculate the percentage change in sales of alcoholic beverages between 2013 and 2015.
A) 23.8%
B) 40%
C) 42.9%
D) 73.3%
Correct Answer:

Verified
Correct Answer:
Verified
Related Questions
Q12: Dr.Goldfinger decides to invest in companies which
Q15: The town of Harmonia gives away all
Q20: Pookie's Pinball Palace restores old Pinball machines.Pookie
Q41: Economics is the study of the _
Q89: Economists reason that the optimal decision is
Q154: What is the "reverse causality" problem in
Q178: Explain the economic assumption that "people are
Q182: Which of the following are primarily macroeconomic
Q199: Trina's Tropical Fish Store sells goldfish for
Q216: "A decrease in the price of digital