Multiple Choice
The figure given below depicts the foreign exchange market for British pounds traded for U.S.dollars. Figure 36.2 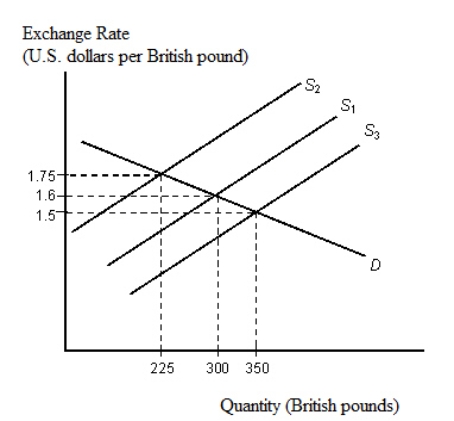 Refer to Figure 36.2.At the initial equilibrium point, with demand curve D and supply curve S1:
A) the price of dollar per British pound is $1.50 and the quantity of British pounds being traded is 225.
B) the price of dollar per British pound is $1.60 and the quantity of British pounds being traded is 225.
C) the price of dollar per British pound is $1.60 and the quantity of British pounds being traded is 300.
D) the price of dollar per British pound is $1.75 and the quantity of British pounds being traded is 350.
E) the price of dollar per British pound is $1.75 and the quantity of British pounds being traded is 300.
Correct Answer:

Verified
Correct Answer:
Verified
Q25: The figure below shows the demand (D)
Q46: The figure given below depicts the foreign
Q48: The figure given below depicts the foreign
Q64: The figure given below depicts the foreign
Q91: The figure given below depicts the foreign
Q98: The figure below shows the demand (D)
Q113: The figure below shows the demand (D)
Q117: The figure given below depicts the foreign
Q123: The figure given below depicts the foreign
Q129: The figure below shows the demand (D)