Multiple Choice
The figure given below depicts the foreign exchange market for British pounds traded for U.S.dollars. Figure 36.2 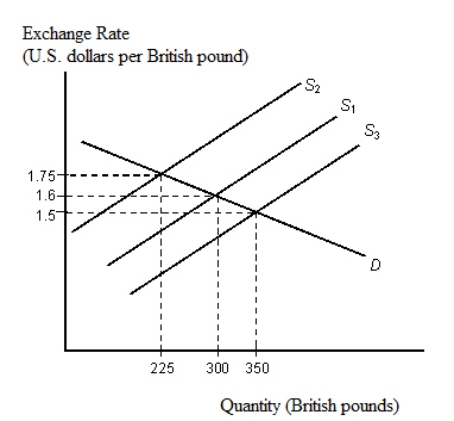 Refer to Figure 36.2.Suppose that the British central bank wishes to maintain a fixed exchange rate of £1 = $1.60.If supply decreases from S1 to S2, the bank must:
A) buy 25 pounds to shift the supply curve from S2 to S1.
B) buy 50 pounds to shift the supply curve from S2 to S1.
C) sell 75 pounds to shift the supply curve from S2 to S1.
D) buy 75 pounds to shift the supply curve from S2 to S1.
E) sell 10 pounds to shift the supply curve from S2 to S1.
Correct Answer:

Verified
Correct Answer:
Verified
Q17: The figure below shows the demand (D)
Q48: The figure given below depicts the demand
Q52: The figure given below depicts the foreign
Q68: The figure given below depicts the foreign
Q86: In 1991,the French mineral water Perrier was
Q99: The figure given below depicts the foreign
Q105: The figure below shows the demand (D)
Q109: The figure below shows the demand (D)
Q118: The figure below shows the demand (D)
Q120: The figure below shows the demand (D)