Multiple Choice
In the following figure, the first panel shows a market situation prior to regulation and the second panel shows the effects of regulation. Figure 26.2 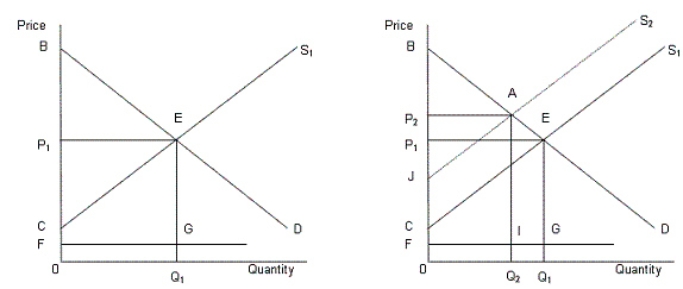 In the figure,
D: Demand curve for automobiles
S1: Supply curve of automobiles prior to regulation
S2: Supply curve of automobiles after regulation
FG: Clean up cost per unit
Refer to Figure 26.2.The regulation will benefit the society if:
A) area BAJ > area 0FIQ2.
B) area AECJ > area IGQ1Q2.
C) area IGQ1Q2 > area AECJ.
D) area BAJ > BAC.
E) area 0FIQ2 > area BAJ.
Correct Answer:

Verified
Correct Answer:
Verified
Q1: Why do the regulated companies oppose deregulation?<br>A)They
Q12: If a market becomes deregulated and is
Q26: <img src="https://d2lvgg3v3hfg70.cloudfront.net/TB1748/.jpg" alt=" -A Herfindahl index
Q28: <img src="https://d2lvgg3v3hfg70.cloudfront.net/TB1748/.jpg" alt=" -Consider an oligopoly
Q31: In the following figure, the first panel
Q36: <img src="https://d2lvgg3v3hfg70.cloudfront.net/TB1748/.jpg" alt=" -Which of the
Q42: Why was trucking deregulated in the U.S.in
Q51: Which of the following statements is true
Q59: <img src="https://d2lvgg3v3hfg70.cloudfront.net/TB1748/.jpg" alt=" -Which of the
Q73: The three phases of antitrust policy in