Multiple Choice
The figure given below depicts the foreign exchange market for British pounds traded for U.S.dollars. Figure 22.2 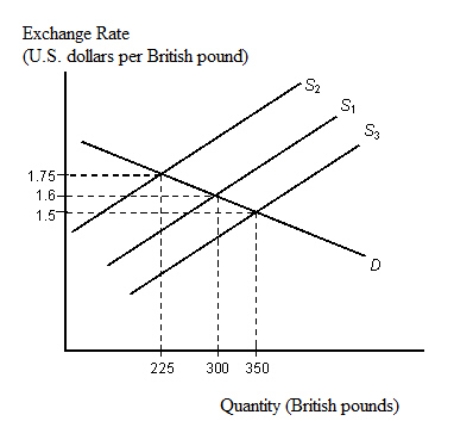 Refer to Figure 22.2.Suppose that the British central bank wishes to maintain a fixed exchange rate of £1 = $1.60.If supply decreases from S1 to S2, the bank must:
A) buy 25 pounds to shift the supply curve from S2 to S1.
B) buy 50 pounds to shift the supply curve from S2 to S1.
C) sell 75 pounds to shift the supply curve from S2 to S1.
D) buy 75 pounds to shift the supply curve from S2 to S1.
E) sell 10 pounds to shift the supply curve from S2 to S1.
Correct Answer:

Verified
Correct Answer:
Verified
Q15: The figure given below depicts the foreign
Q23: The figure given below depicts the foreign
Q35: The figure given below depicts the foreign
Q54: Deviations from purchasing power parity will be
Q55: The figure given below depicts the foreign
Q88: The figure below shows the demand (D)
Q92: The figure given below depicts the demand
Q119: The figure below shows the demand (D)
Q125: The figure given below depicts the foreign
Q128: The figure below shows the demand (D)