Multiple Choice
The figure given below depicts the demand and supply of Brazilian reals in the foreign exchange market.Assume that the market operates under a flexible exchange rate regime. Figure 21.1 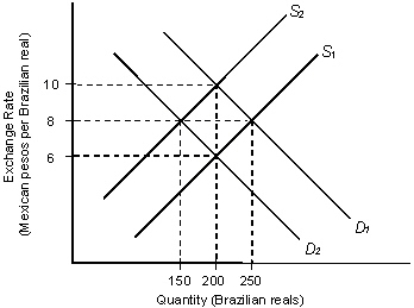 In the figure:
D1 and D2: Demand for Brazilian reals
S1 and S2: Supply of Brazilian reals
Refer to Figure 21.1.Suppose the initial equilibrium exchange rate is 10 pesos per real.A decrease in the Mexican demand for Brazilian coffee, other things equal, is most likely to result in a new equilibrium exchange rate of:
A) 6 pesos per real and an equilibrium quantity of 200 Brazilian reals.
B) 6 pesos per real and an equilibrium quantity of 250 Brazilian reals.
C) 8 pesos per real and an equilibrium quantity of 150 Brazilian reals.
D) 8 pesos per real and an equilibrium quantity of 100 Brazilian reals.
E) 10 pesos per real and an equilibrium quantity of 200 Brazilian reals.
Correct Answer:

Verified
Correct Answer:
Verified
Q2: The figure given below depicts the foreign
Q3: The figure given below depicts the foreign
Q28: If a dollar invested in the United
Q41: The figure given below depicts the foreign
Q43: The figure given below depicts the foreign
Q54: Deviations from purchasing power parity will be
Q98: The figure below shows the demand (D)
Q101: The figure below shows the demand (D)
Q114: The figure below shows the demand (D)
Q126: The figure given below depicts the foreign