Multiple Choice
The figure given below depicts the demand and supply of Brazilian reals in the foreign exchange market.Assume that the market operates under a flexible exchange rate regime. Figure 21.1 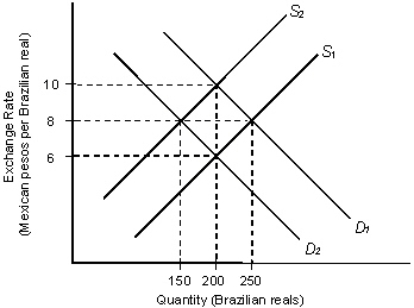 In the figure:
D1 and D2: Demand for Brazilian reals
S1 and S2: Supply of Brazilian reals
Refer to Figure 21.1.Assume that the initial equilibrium exchange rate is 6 pesos per real.Other things remaining equal, an increase in the number of Brazilian tourists to Mexico is most likely to:
A) keep the equilibrium exchange rate constant.
B) shift the demand curve for pesos to the right.
C) shift the supply curve of pesos to the left.
D) shift the demand curve for pesos to the left.
E) shift the supply curve of pesos to the right.
Correct Answer:

Verified
Correct Answer:
Verified
Q5: The figure given below depicts the foreign
Q10: The figure given below depicts the foreign
Q18: The figure given below depicts the foreign
Q35: The figure given below depicts the foreign
Q53: The figure below shows the demand (D)
Q59: The figure below shows the demand (D)
Q83: The figure below shows the demand (D)
Q94: The figure given below depicts the foreign
Q118: The figure below shows the demand (D)
Q129: The figure below shows the demand (D)