Multiple Choice
The figure given below shows the demand curves for dollars arising out of Thai demand for U.S.goods and services and the supply of dollars arising out of the U.S.demand for Thai goods, services, and financial assets.D1 and S1 are the original demand and supply curves. Figure 18.2 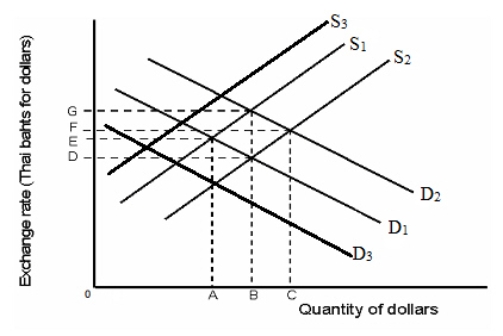 Refer to Figure 18.2.Suppose investors predict that the value of Thai assets will decrease in the near future.This affects the current equilibrium exchange rate.To restore the original equilibrium, the Thai government intervenes in the foreign exchange market.How will this government action appear on the graph?
A) As a shift in the demand curve from D2 to D1
B) As a shift in the demand curve from D1 to D3
C) As a shift in the supply curve from S1 to S3
D) As a shift in the supply curve from S1 to S2
E) As a shift in the demand curve from D2 to D3
Correct Answer:

Verified
Correct Answer:
Verified
Q52: Supporters of globalization argue that increased globalization
Q53: Which of the following is true of
Q54: Identify the correct statement.<br>A)Between the 1960s and
Q55: According to evidence from around the world,
Q56: As the Asian financial crisis of 1997
Q58: Poor and developing countries are ranked on
Q59: The financial crises of the 1990s pointed
Q60: The figure given below shows the demand
Q61: Critics of globalization argue that international trade
Q62: The phrase "race to the bottom" refers