Multiple Choice
The figure given below shows the Phillips curves of the U.S.economy during early 1960s to late 1970s. Figure 14.2 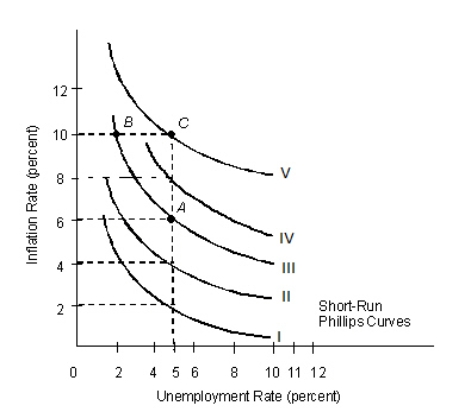 Refer to Figure 14.2.If the natural rate of unemployment is 5 percent, which of the following would cause a movement along Phillips curve III from point A to point B?
A) An inward shift of the aggregate demand curve
B) An outward shift of the aggregate demand curve
C) A movement down along the aggregate supply curve
D) A movement down along the aggregate demand curve
E) A movement up along the aggregate demand curve
Correct Answer:

Verified
Correct Answer:
Verified
Q19: If the short-run Phillips curve shifts to
Q20: Hyperinflation in developing countries is typically the
Q21: To some economists, the "great moderation" means:<br>A)small
Q22: Suppose the inflation rate has risen 0.5
Q23: Which of the following shifts the aggregate
Q25: Which of the following would not be
Q26: Identify the correct statement.<br>A)The removal of financial
Q27: Contrary to what believers in the Phillips
Q28: The shape of the long-run Phillips curve
Q29: More stable macroeconomic policy does not contribute