Multiple Choice
The figure given below represents the short run and long run Phillips curve. Figure 14.4 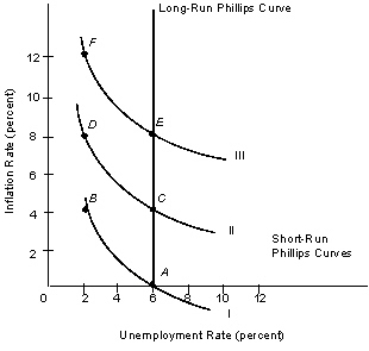 Refer to Figure 14.4.A movement from point A to point C would be associated with an:
A) outward shift of both the aggregate demand and the aggregate supply curve.
B) outward shift of the aggregate supply curve and an inward shift of the aggregate demand curve.
C) outward shift of the aggregate demand curve and an inward shift of the aggregate supply curve.
D) outward shift of the aggregate demand curve but no change in the aggregate supply curve.
E) inward shift of both the aggregate demand and the aggregate supply curve
Correct Answer:

Verified
Correct Answer:
Verified
Q3: Suppose that the economy has witnessed an
Q4: Suppose workers do not believe the Fed
Q5: Following a decline in the inflation rate,
Q6: The key feature due to which unexpected
Q7: The long run Phillips curve assumes that
Q9: The long-run Phillips curve corresponds to the
Q10: A recessionary real shock will:<br>A)shift the aggregate
Q11: According to the rational expectations view:<br>A)the economy
Q12: The reservation wage is the minimum wage
Q13: If the percentage increase in nominal wage