Multiple Choice
The figure given below depicts the equilibrium in the foreign exchange market. Figure 13.1 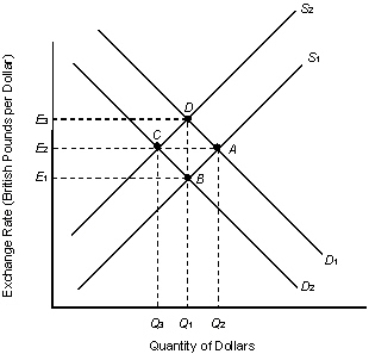 Refer to Figure 13.1.If the current equilibrium exchange rate is E1 what action would the Fed have to take to achieve a target exchange rate of E2?
A) Sell (Q2 - Q1) amount of U.S.dollars.
B) Buy (Q1 - Q3) amount of U.S.dollars.
C) Buy (Q2 - Q3) amount of U.S.dollars.
D) Buy (Q2 - Q1) amount of U.S.dollars.
E) Sell (Q1 - Q3) amount of U.S.dollars.
Correct Answer:

Verified
Correct Answer:
Verified
Q71: If the money supply is $80 billion,
Q72: When the government raises spending to promote
Q73: During the Christmas holiday season, the Fed
Q74: The table given below shows the assets
Q75: Each district bank of the Fed comprises
Q77: There is an inverse relationship between the
Q78: The supply of the U.S.dollar on the
Q79: The figure given below depicts the equilibrium
Q80: Which of the following will be observed
Q81: When the FOMC sets a monetary policy,