Multiple Choice
The figure given below depicts the equilibrium in the foreign exchange market. Figure 13.1 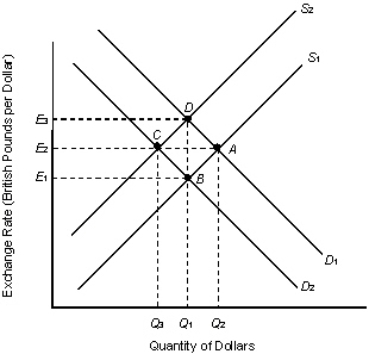 Refer to Figure 13.1.If the exchange rate is fixed at E2 but the free market equilibrium rate is E1 then:
A) there is a shortage of British pounds at E1.
B) no intervention is necessary to achieve the exchange rate E1.
C) there is a permanent surplus of U.S.dollars at E1.
D) there is a permanent surplus of U.S.dollars at E2.
E) there is a permanent shortage of U.S.dollars at E3.
Correct Answer:

Verified
Correct Answer:
Verified
Q7: If the U.S.dollar depreciates against the yen
Q8: The quantity of excess reserves in the
Q9: An outward shift of the money demand
Q10: The transactions demand for money increases when
Q11: According to the equation of exchange, a
Q13: The interest rate represents the opportunity cost
Q14: The sum of the coins and currencies
Q15: If a percentage decrease in money supply
Q16: Suppose the interest rate on a bond
Q17: When the foreign exchange value of the