Multiple Choice
In the figure given below panel A represents money market equilibrium, panel B represents investment demand, and panel C represents equilibrium real GDP. Figure 13.3 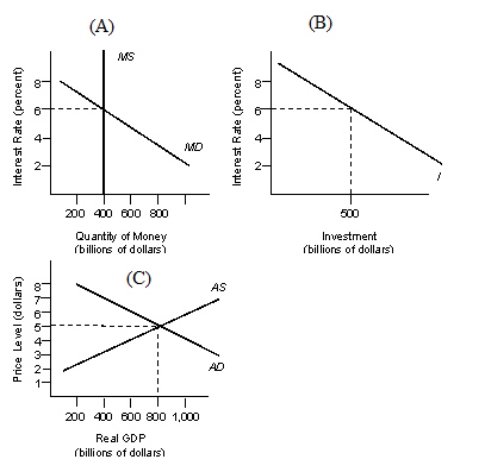 Assume the economy is in equilibrium as illustrated by Figure 13.3.Based on the equation of exchange, what is the velocity of money?
A) 10
B) 6
C) 5
D) 20
E) 2
Correct Answer:

Verified
Correct Answer:
Verified
Q25: The Federal Reserve (Fed)was created by the
Q26: Which of the following monetary policies will
Q27: The Federal Reserve System was created in
Q28: The desire to keep assets in cash
Q29: The Fed has set a uniform reserve
Q31: When more than one central bank attempts
Q32: What is the current market price of
Q33: Increased demand for U.S.products by foreign residents
Q34: Which of the following people is most
Q35: If a bond pays 11.5 percent interest