Multiple Choice
In the following figure, the first panel shows a market situation prior to regulation and the second panel shows the effects of regulation. Figure 12.2 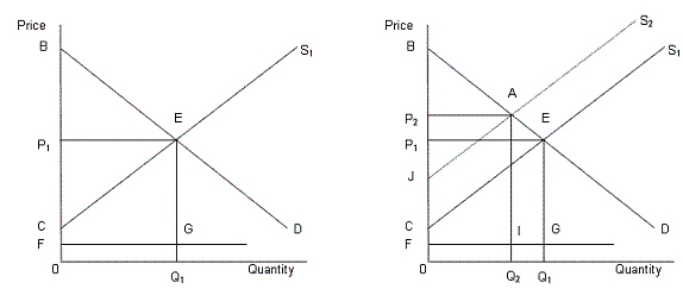 In the figure,
D: Demand curve for automobiles
S1: Supply curve of automobiles prior to regulation
S2: Supply curve of automobiles after regulation
FG: Clean up cost per unit
According to Figure 12.2, the total clean up cost after the regulation is:
A) area 0FIQ2.
B) area 0FGQ1.
C) area BEC.
D) area BEP1.
E) area BEGF.
Correct Answer:

Verified
Correct Answer:
Verified
Q6: <img src="https://d2lvgg3v3hfg70.cloudfront.net/TB1748/.jpg" alt=" -A market that
Q18: In the following figure, the first panel
Q27: In the following figure, the first panel
Q42: Why was trucking deregulated in the U.S.in
Q51: In the following figure, the first panel
Q68: <img src="https://d2lvgg3v3hfg70.cloudfront.net/TB1748/.jpg" alt=" -A Herfindahl index
Q72: In the following figure, the first panel
Q82: In the following figure, the first panel
Q90: Which of the following statements best describes
Q99: In the following figure, the first panel