Multiple Choice
In the following figure, the first panel shows a market situation prior to regulation and the second panel shows the effects of regulation. Figure 12.2 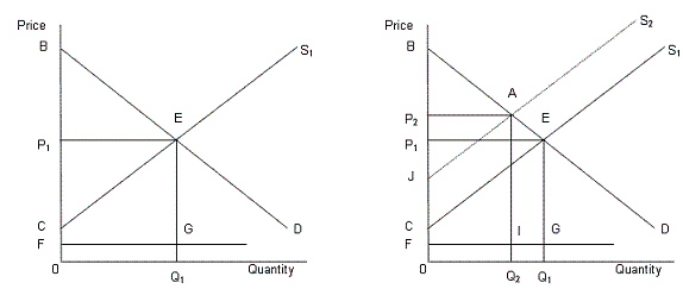 In the figure,
D: Demand curve for automobiles
S1: Supply curve of automobiles prior to regulation
S2: Supply curve of automobiles after regulation
FG: Clean up cost per unit
According to Figure 12.2, the total societal surplus after the regulation is:
A) area BEC.
B) area AECJ.
C) area IGQ1Q2.
D) area 0FIQ2.
E) area BAJ.
Correct Answer:

Verified
Correct Answer:
Verified
Q1: Why do the regulated companies oppose deregulation?<br>A)They
Q9: In the following figure, the first panel
Q12: In the following figure, the first panel
Q29: In the following figure, the first panel
Q41: In the following figure, the first panel
Q43: Which of the following is a measure
Q54: If the tax rate increases with an
Q69: Which of the following is true of
Q74: When regulating a natural monopoly,government officials face
Q84: In the following figure, the first panel