Multiple Choice
The figure given below shows the consumption function of a household. Figure 9.2 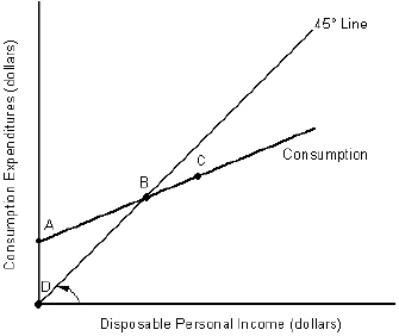 In Figure 9.2, the line segment AD represents:
A) autonomous consumption.
B) the maximum amount of saving.
C) negative consumption.
D) zero consumption.
E) autonomous income.
Correct Answer:

Verified
Correct Answer:
Verified
Q21: An increase in disposable income will cause
Q22: Economists have proved that a substantial increase
Q23: When the U.S.government removes investment tax credits:<br>A)consumption
Q24: The slope of the aggregate expenditures function
Q25: The amount of autonomous consumption in an
Q27: Which of the following is true of
Q28: The figure given below shows the consumption
Q29: In the table given below Y represent
Q30: The table given below reports the consumption
Q31: Keynesian economics developed in response to:<br>A)the Great