Multiple Choice
The figure given below represents the consumption function of a country. Figure 9.3 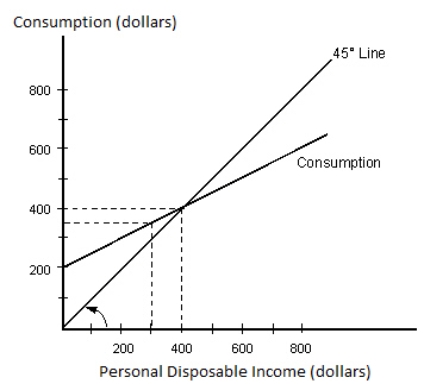 Refer to Figure 9.3.Calculate the marginal propensity to consume.
A) 0.7
B) 0.1
C) 0.4
D) 0.25
E) 0.5
Correct Answer:

Verified
Correct Answer:
Verified
Related Questions
Q105: The United States introduced investment tax credit
Q106: When disposable income is zero, consumption is
Q107: A change in the marginal propensity to
Q108: Which of the following factors will not
Q109: At the point where consumption equals disposable
Q110: Which of the following is a stock
Q111: The net export function illustrates that:<br>A)net exports
Q113: If capacity utilization by businesses remains constant,
Q114: The sum of money spent by a
Q115: If a household experiences a $880 increase