Multiple Choice
The figure given below represents the consumption function of a country. Figure 9.3 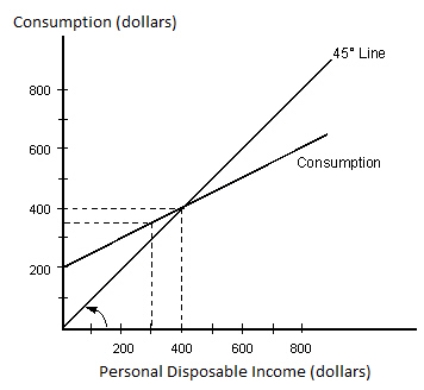 Refer to Figure 9.3.We can infer that the marginal propensity to save would be _____.
A) 0.7
B) 0.1
C) 0.4
D) 0.25
E) 0.5
Correct Answer:

Verified
Correct Answer:
Verified
Related Questions
Q99: The figure given below represents the saving
Q100: Suppose that the U.S.trade balance is positive.Hence,
Q101: Suppose total disposable income in Country X
Q102: Which of the following is a determinant
Q103: A change in consumption caused by a
Q105: The United States introduced investment tax credit
Q106: When disposable income is zero, consumption is
Q107: A change in the marginal propensity to
Q108: Which of the following factors will not
Q109: At the point where consumption equals disposable